Properly sizing a pump to specific application requirements is a complicated process. It accounts for many factors including fluid type, elevation changes, length/diameter of pipe, number of joints or bends, and requires some complex equations usually left to system engineers. If you already have a good idea of your flow and pressure requirements, however, pump curves can be very useful in determining if a pump can operate efficiently within the requirements of your fluid transferring application. In cases of centrifugal pumps, they can also help determine impeller size and HP options for pumps that have multiple options.
Before we dive into examples, it’s important to understand the following definitions in order to read these types of pump performance curves.
Flow: The volume of fluid that will be transferred per minute. This is measured as GPM, Gallons per Minute.
Head: A measure of required pressure. In other words, it is the energy that must be applied for the amount of flow required at the point of discharge. Factors that contribute to the “dynamic head” (the adjusted pressure requirement after all factors are accounted for) are required flow rate, elevation change, and resistance factors like number of bends and pipe size and pipe material.
Formula for PSI: Feet of Head/2.31=1 PSI (This works for products with 1.0 Specific gravity): In a pump curve, pressure is expressed in Feet of Head. If you have a traditional expression of pressure, like PSI, you can multiply it by 2.31 to express that pressure in required feet of head.
BEP: The Best Efficiency Point. The BEP shows a point on a pumps performance curve is where the pump will operate at the highest efficiency for correlating head or flow rate.
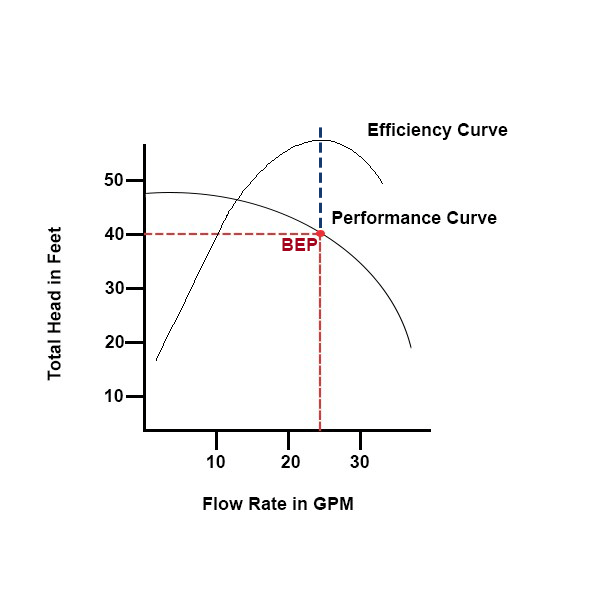
Manufacturers will test pumps under varying conditions to come up with the performance curve. This curve illustrates the pump’s performance as it relates to flow and head. They will also test for the maximum efficiency of the pump, shown as the efficiency curve. The top of the efficiency curve shows the conditions in which the pump will run at peak efficiency. If desired Flow and Head for the application are both known, the intersection of those two values on the graph is the desired point of operation. Plotting this point over both the performance curve and efficiency curve for any given pump will give a good indication of whether that pump can effectively handle the application.
For example, in the basic pump curve example below there is a point plotted at 40 ft. of head and a flow rate of 24 GPM. This point happens to fall directly on the pump performance curve, meaning that this particular pump has been tested to perform at those exact conditions – overcoming 40ft of head with 24GPM at the point of discharge. We can also see that this point lines up directly with the top of the efficiency curve (blue dotted line). This means that not only will the pump deliver the desired pressure and flow rate at this point, but it will also be running at its maximum efficiency. Therefore, this point is the Best Efficiency Point (BEP).
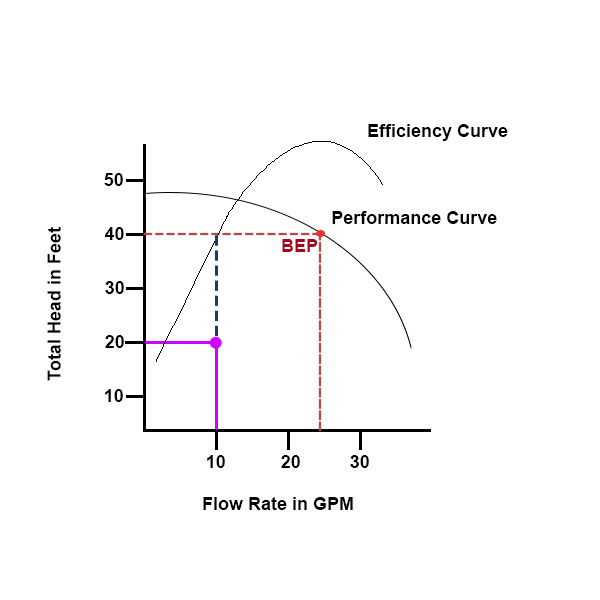
It’s important for the pump to not deviate to far-right or left from its BEP. This can lead to cavitation, excessive vibration, as well as higher radial and thrust loads on the pump. These in turn can cause wear and tear on the internal components, as well as increased heat that will lead to further breakdown. If, in the example below, the application required 20 feet of head and a flow rate of 10 GPM (illustrated in pink), the desired point of operation would be far from the ideal points on the performance and efficiency curves and would not be the ideal choice for the application.
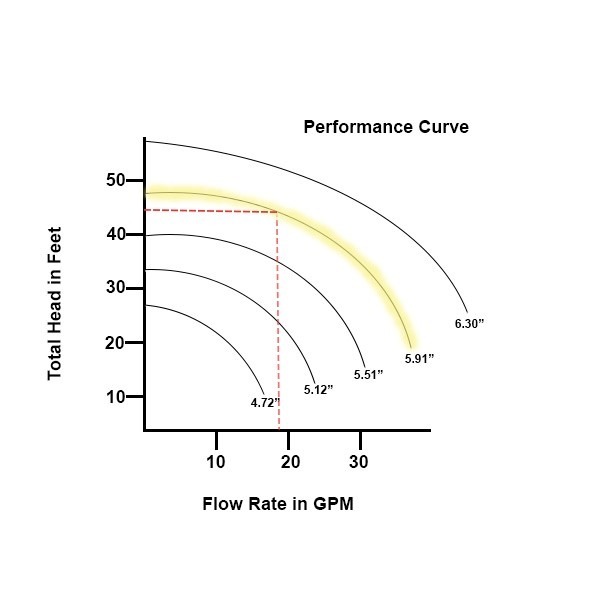
If the pump had fixed sized components and operating controls, it would be a very easy pump curve to read (like in the examples above). One of the variants that will add multiple curved lines when reading a pump curve is the impeller size. The greater the pump’s range of impeller size options, the more curves will be shown. In the figure below you can see multiple curves and at the bottom is a number that indicates different impeller size options from 4.72” to 6.30’’. If, for example, you needed to overcome 45 ft of the head with a 19GPM at discharge, the pump fitted with a 5.91” impeller would be the best solution.
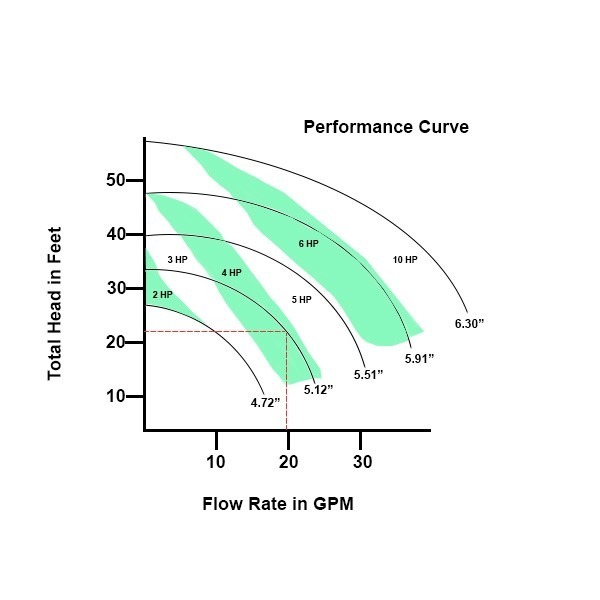
Another variant that you will see on more detailed pump curves is power output, most commonly expressed in Horsepower. The efficiency to move a volume of liquid at a specific height is also dependent on this power output, and centrifugal pump curves will indicate the horsepower that should be used with the intended Flow and Head along with the size of the impeller being used. The Figure below shows a pump with horsepower capabilities between 2 – 10 horsepower. The light green shades separate the different horsepower ranges. If, for example, you wanted to overcome 22 feet of head with a flow rate of 20 GPM at discharge, then the most efficient option would be a 5.12” impeller running at roughly 4.8 HP.
Depending on the pump type and available options, pump curves can range from simple and straight-forward to complex with multiple configurations. We did not dive into the more complex options in this article, but knowing the basic principles of plotting a point of operation against performance and efficiency curves builds the foundation for understanding these graphs and eventually being able to read the more complex pump curves.
Anderson Process has expert knowledge on selecting pumps to assist with finding the right equipment for your fluid transferring process. Speak with us today on how we can help find you the right solution.