Being able to read positive displacement pump curves is important to determine a pump’s ability to produce flow under several conditions, such as viscosity and differential pressure, which can affect pump performance. It is also vital to understanding what the pump is capable of and how to possibly diagnose issues that arise. The following article discusses how to read and understand positive displacement pump curves.
What is a Positive Displacement Pump?
A positive displacement pump transports a fixed, enclosed volume of liquid in a cyclical motion, eventually forcing the liquid to be evacuated through a discharge pipe or discharge system. P.D. pumps typically specialize in pumping viscous liquids that contain suspended or fragile solids. Not capable of producing high flow rates like centrifugal pumps, P.D. pumps however, are capable of producing much higher pressures. P.D. pumps are typically driven by screws, pistons, diaphragms, vanes and rollers.
Centrifugal Pump Vs. Positive Displacement Pump Curves
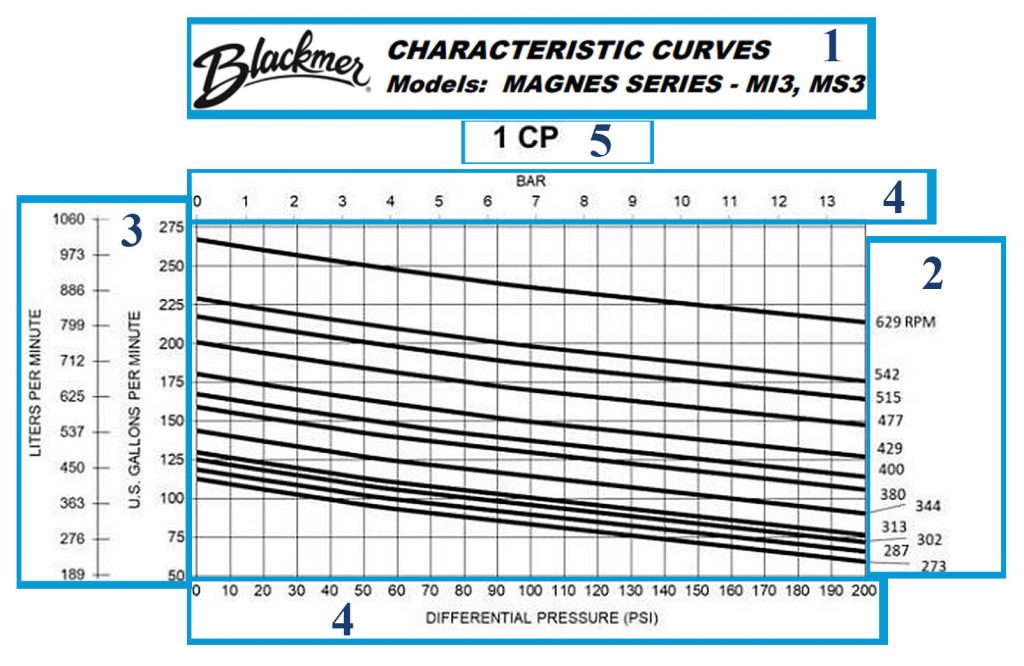
Positive displacement pump curves are different from centrifugal pumps curves because positive displacement pump curves usually appear as a straight line, while centrifugal pump curves have an actual curve to them. The reason is that positive displacement pump flow directly corresponds to pump speed (RPM) and does not decrease with pressure like a centrifugal pump. P.D. pumps maintain constant efficiency. Pump curves are a visual aid demonstrating how the pump will provide a range of flows at varying pressures. All positive displacement pump manufacturers will display their pump curves differently. However, they all will typically exhibit a separate axis’ detailing viscosity, flow rate against viscosity, horsepower, pump speed and will have the pump brand and model at the top of the chart (#1 on the pump curve chart, Models: Magnes Series MI3, MS3 Models).
Pump Speed
Pump speed (#2 on pump curve chart measured in RPM) is predicated on the speed the pump is operating at and not the motor speed. The reason it’s predicated on pump speed and not motor speed is that pump speed altering equipment, such as gear reducers, v-belts and variable speed drives control the operating speed of the pump. The maximum allowable speed is also typically shown on the pump curves chart, since most pumps can’t run at what the top motor speed is.
Flow
The flow (#3 on pump curve chart, measured in GPM/Liters Per Minute) is determined by pump speed (RPM). Once the pump speed information is known you can determine the flow on the pump curves chart. If the shaft speed or impeller diameter is modified on the pump, the flow will change proportionally. If for instance, the speed of a pump is reduced by 25%, the flow at the same head will also decrease 25%. As mentioned previously, in the pictured example, the lines from RPM (speed) to GPM (flow) are straight lines, demonstrating their corresponding efficiency and cooperative relationship.
Differential Pressure
The discharge pressure of the pump is equal to the suction pressure of the pump plus the pressure the pump is designed to develop:
Suction Pressure + Designed Pump Pressure = Discharge Pressure
The difference between those two applied pressures (designed pump pressure, suction pressure of the pump) is the differential pressure (#4 on pump curve chart measured in RPM and BAR). For example, if the pressure entering the pump is 20 PSI and the pump is designed to develop 50 PSI the discharge pressure would be 70 PSI. The differential pressure would then be 20 PSI. According to the chart in this case, a Blackmer Magnes MI3, MS3 pump running at 542 RPM would generate a flow of 200 GPM and the differential pressure would be 90 PSI at 1 CP (centipoise) dynamic viscosity.
Viscosity
Positive displacement pumps are better at pumping more viscous fluids than centrifugal pumps but are still affected by the viscosity (#5 on the pump curve chart measured in centipoise (CP) of the fluid they are pumping. A pump running a high viscosity fluid through it, affects the allowable pump speed the pump can run at. When viscosity increases, resistance to flow increases, so to maintain a consistent flow rate the pump will require more horsepower. Dynamic Viscosity, which is a measure of fluid’s resistance to flow is measured in centipoise units. For perspective, water is 1 centipoise, while a more viscous liquid like corn syrup is 5000 centipoise. The pictured P.D. pump curve chart has 1 CP (Centipoise) at the top of the chart displaying how the pump models (Blackmer Magnes MI3, MS3) perform against a liquid with the same viscosity as water.
Other factors that can affect viscosity and pump selection are fluid density and if the liquid is shear sensitive. Density is a measure of a fluid’s weight by volume. A liquid like corn syrup will weigh more than a liquid like water for example and will require more horsepower to transport it. Shear sensitive liquids change viscosity when under stress. Some liquids become thinner when under pressure, which is called shear thinning, while other liquids become thicker (shear thickening). Understanding the attributes of the liquid being pumped is important to know when selecting the best pump to achieve process goals.
What is Pump Slip?
Positive displacement pumps are affected by what’s known in the pump industry as “slip.” Slip happens when a fluid that is being pumped “slips” away from the discharge side of the pump back to the suction side of the pump and is recirculated. Slip is influenced by system discharge pressure requirement and fluid viscosity. The more viscous the fluid the less slip happens due to the fact it’s more difficult to move and slip back to the suction side then a thinner liquid. Some PD pump curves will display multiple curves to correct for the amount of fluid that typically “slips.”
Bracket Horsepower and Kilowatts
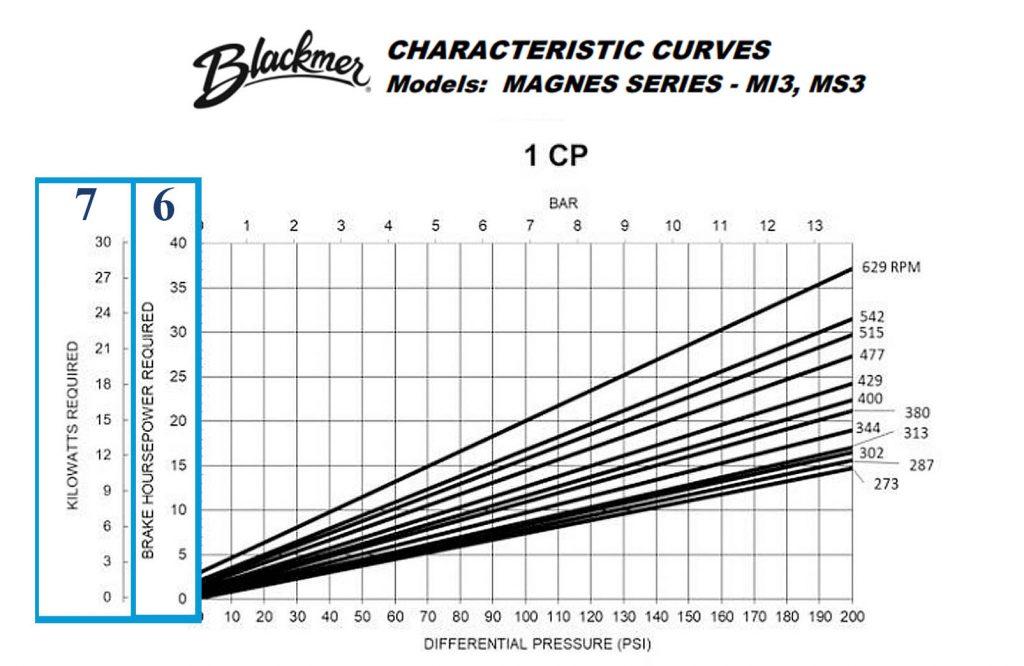
Pump Horsepower is influenced by the viscosity of the pumped fluid and the discharge pressure required. Brake Horsepower (BHP) (#6 on the pump curve chart, Brake Horsepower Required) is the power the pump requires to overpower the discharge pressure. Brake Horsepower is determined by adding work horsepower (WHP) and the viscous horsepower (VHP) together:
WHP + VHP = BHP
Working Horsepower (WHP) is the amount of horsepower needed to accomplish the desired flow rate with system components, that would cause a pressure drop, factored in. Viscosity HorsePower (VHP), sometimes called internal horsepower, is the minimum amount of horsepower needed to overcome the viscosity of the fluid and allow the rotating parts of the pump to turn.
A kilowatt is a unit to measure power and is equivalent to 1000 watts. Roughly 1.34 BHP Horsepower used is equal to 1 kilowatt. For example, on the pictured PD pump curve chart (#7 Kilowatts Required), to use 40 BHP means 30 kilowatts of power will be needed to run the pump.
Total Dynamic Head
Pump curves can help you select the right pump for the application, but knowing total dynamic head is an important first step. Total Dynamic Head (TDH) is the amount of PSI of pressure on the suction side of the pump, plus the total height that a fluid is to be pumped plus the friction loss caused by the internal pipe’s material or corrosion.
TDH = Static Height + Static Lift + Friction Loss
Knowing TDH is needed in order to determine the correct sizing, (impeller size, motor size, etc.…) and scale of a pump needed to suit your application.
Positive Displacement pumps are extremely helpful at dealing with tricky, viscous media and producing high pressures. Understanding how to read positive displacement pump curves will put you on the right path to achieving your production process objectives.